Elasticsearch: Workload Adaptive Shard Placement Algorithm - Part 1
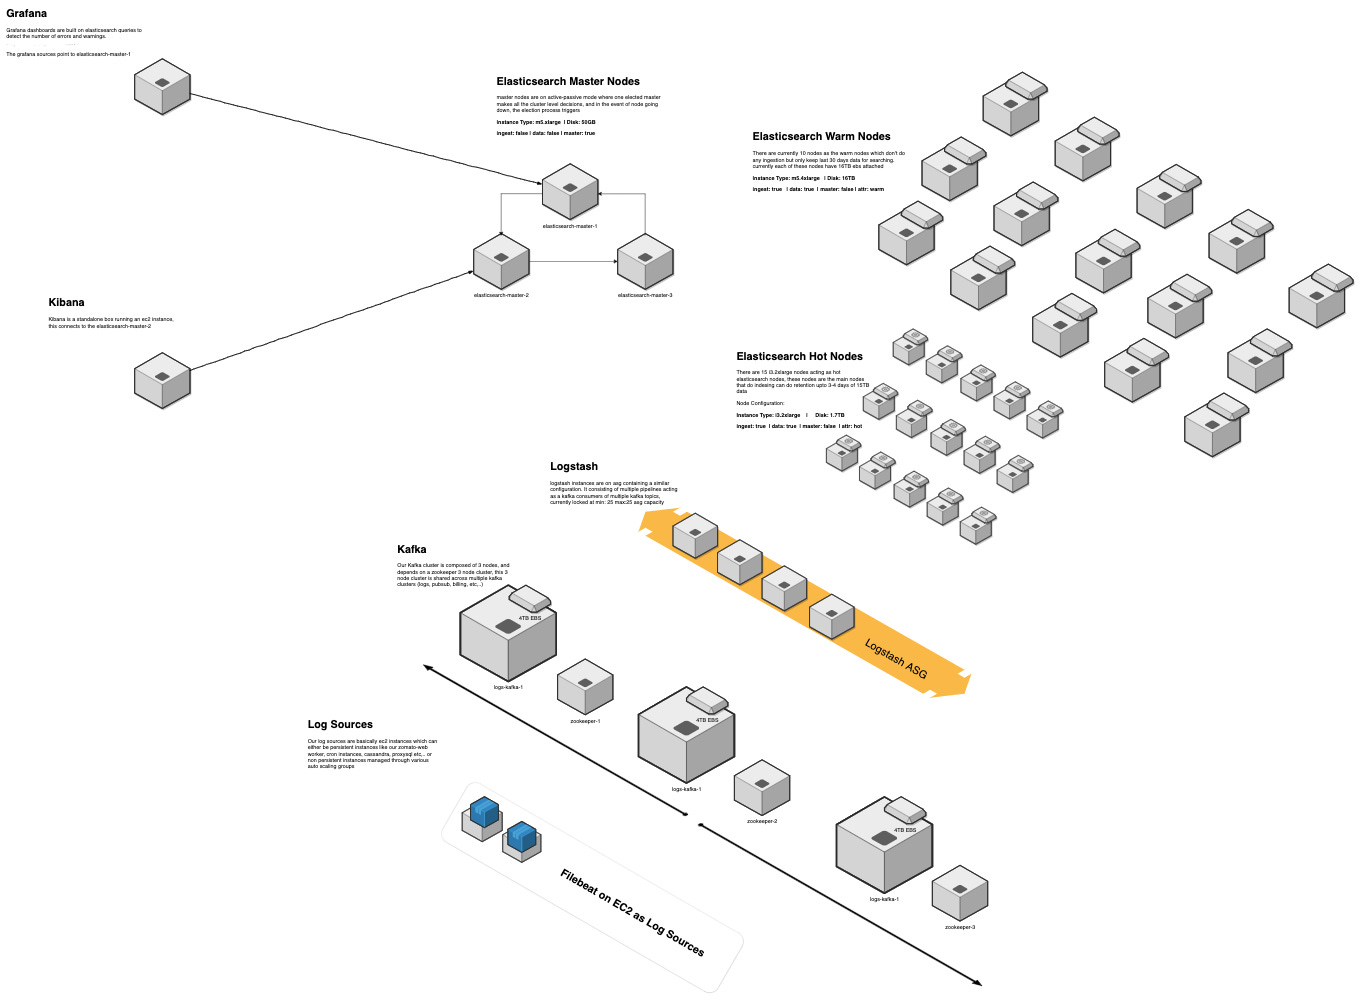
our elasticsearch cluster(part of our elk stack) is a pretty standard cluster hot/cold cluster.

where logstash writes today’s logs data to hot nodes and the next day early morning those indices get moved to the cold nodes, we do this by keeping our index pattern as {index-name}-yyyy.mm.dd the yyyy.mm.dd is derived from now() in the logstash.
We strongly believe in structured logging and so we keep different elasticsearch indices for different micro-services.
So at precisely 00:00 a whole new set of indices are created for different micro-services.
Service Time range Elasticsearch Index Name search-service 00:00 Jan 14th - 23:59 Jan 14th search-service-2020.01.14 menu-service 00:00 Jan 14th - 23:59 Jan 14th menu-service-2020.01.14 … … … search-service 00:00 Jan 15th - 23:59 Jan 15th search-service-2020.01.15 menu-service 00:00 Jan 15th - 23:59 Jan 15th menu-service-2020.01.15
So this workflow presents a very interesting problem. at the start of the day i.e 00:00 all indices doesn’t have any data so each of them have equal weights and elasticsearch gives equal weights to those indices and allocates on the appropriate hot nodes.
Let’s say the search service log throughput is 5 times of menu service log throughput and we have a 2 hot node and 2 cold nodes and our indices have 2 shards each with 0 replicas, below table presents a hypothetical scenario of shard placement
time: 00:00
Shard Node Disk Usage search-service-1 es-hot-1 0 bytes search-service-2 es-hot-2 0 bytes menu-service-1 es-hot-1 0 bytes menu-service-2 es-hot-2 0 bytes
time: 23:59
Shard Node Disk Usage search-service-1 es-hot-1 5 GB search-service-2 es-hot-2 5 GB menu-service-1 es-hot-1 1 GB menu-service-2 es-hot-2 1 GB
if you observed in the above hypothetical scenario the data is equally balanced in both es-hot-1 and es-hot-2, each containing 6 GB
but at the start of the day i.e at 00:00 each shard gets equal weight which means that the below placement state is equally possible
time: 00:00
Shard Node Disk Usage search-service-1 es-hot-1 0 bytes search-service-2 es-hot-1 0 bytes menu-service-1 es-hot-2 0 bytes menu-service-2 es-hot-2 0 bytes
in the above placement state, es-hot-1 will contain 5 times the data of es-hot-2 and also throughout the day, es-hot-1 cpu utilization will be 5 times that of es-hot-2 cpu utilization.
in a much complex scenario consisting of 150 micro-services indices and each of them having multiple shards, a wrong placement on a bad day can throttle the entire logstash pipeline because of a single node. this gets even more complicated if auto rebalancing is enabled over the storage which basically moves the shards around when elasticsearch notices disk is unequal across nodes
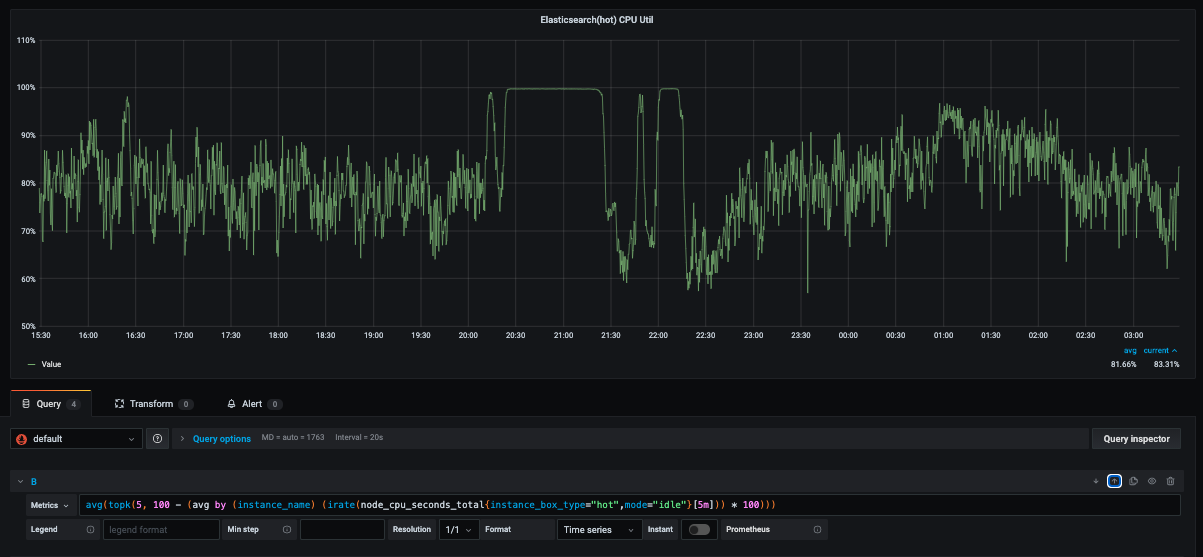
This imbalance is only a part of the core problem. the major problem is when this imbalance leads to a node being too hot and reaches 100% cpu utilization. imagine we have 5 shards of a high throughput index and 5 nodes(these nodes also contain other low/high throughput shards), if one of the node was to reach 100% cpu utilization now the entire index throughput gets throttled because docs are hashed and stored according to their hash which means that every 5th document has much higher indexing latency than other logs, in a pipeline this means that single node is throttling down the entire pipeline throughput.
Below shows the standard deviation of cpu utilization across nodes, if utilization is equal across all nodes, the stddev would be 0. at 8PM the stddev increases too high because then the cpu util reaches 100% on a few nodes which heavily throttles down the pipeline and so the other nodes indexing as well drops down by a significant factor leading to spike in the stddev.

# higher the stddev, the more unbalanced your cluster is,
#   applies to all distributed systems like cassandra,
#   kafka consumers consuming multiple partitions etc,..

stddev(
  sum by (instance_name) (
    1 - (
      irate(
        node_cpu_seconds_total{job="elasticsearch" instance_box_type="hot",mode="idle"}[5m]
      )
    )
  )
)
↓ avg cpu utilization of top 5 nodes in the hot node cluster

Solution
we basically need to give hints to elasticsearch on how to place the shards so that as the day progresses the data remains balanced across all nodes and the cpu utilization as well remains equal across all nodes.
these hints can easily be generated from yesterday’s data, So we made one placement decider plugin which simply takes a input setting on where to place the shards of an index in which nodes. We give this plugin a hypothetical input like
{
  "search-service-1": "es-hot-1",
  "search-service-2": "es-hot-2",
  "menu-service-1": "es-hot-1",
  "menu-service-2": "es-hot-2"
}
now the plugin with this information would participate in the elasticsearch shard allocation decision chain and decide where a shard should be placed. elasticsearch uses multiple shard allocation deciders to allocate shards according to various heuristics like placing shards according to node attributes like hot and cold or placing the shards to balance out the storage across all nodes and a few others.
ShardPlacementAllocationDecider.java:canShardAllocateHelper
The plugin registers itself to this list of allocation deciders and gives yes or no to allocation decisions that elasticsearch performs and achieve our placement configuration given in the above json. now we need an easy way to give such input to the plugin, we found index settings to be an easy way achieve this goal.
ShardPlacementAllocationDecider.java: plugin settings input
Even after such a plugin to provide hints to the elasticsearch, we still endup with a problem similar to N-Partition problem which is an np-complete problem as we have a set of shards and we need to distribute those shards equally in the nodes to achieve equal utilization i.e partitioning a set of n integers into k partitions so that the stddev of those k partitions is minimum. part 2 of this post shows various approximation algorithms we used to reduce as much stddev as we could
Results
coming soon in part 2


